Android Studio is full of useful features for rapidly developing and testing your application. One of the features is support for debugging.
The following are some of the ways you can debug your application.
Logging
The easiest way to debug an application is by logging messages.
Java programmers like to use logging utilities, such as Commons Logging and Log4J, to log messages.
The Android framework provides the android.util.Log class for the same purpose.
The Log class comes with methods to log messages at different log levels. The method names are short: d (debug), i (info), v (verbose), w (warning), e (error), and wtf (what a terrible failure).
This methods allow you to write a tag and the text.
For example,
Log.e("activity", "Something went wrong");
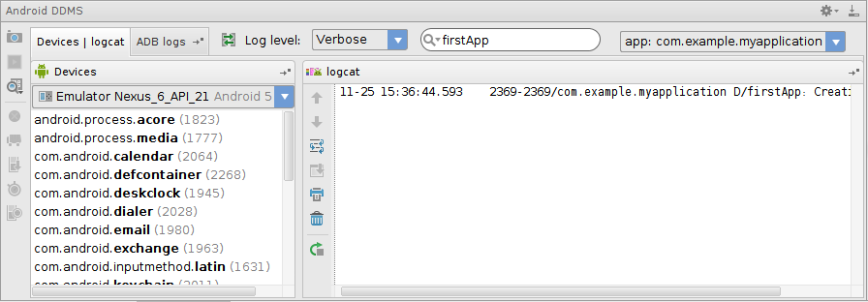
During development, you can watch the Android DDMS view at the bottom of Android Studio’s main screen.
The good thing about LogCat is that messages at different log levels are displayed in different colors.
In addition, each message has a tag and this makes it easy to find a message. In addition, LogCat allows you to save messages to a file and filter the messages so only messages of interest to you are visible.
The LogCat view is shown in Figure 24.21.
Any runtime exception thrown, including the stack trace, will also appear in LogCat, so you can easily identify which line of code is causing the problem.
Setting Breakpoints
The easiest way to debug an application is by logging messages. However, if this does not help and you need to trace your application, you can use other debugging tools in Android Studio.
Try adding a line breakpoint in your code by clicking on a line and selecting Run > Toggle Line Breakpoint. Figure 24.22 shows a line breakpoint in the code editor.

Now, debug your application by selecting Run > Debug app.
The Debug view is shown in Figure 24.23.
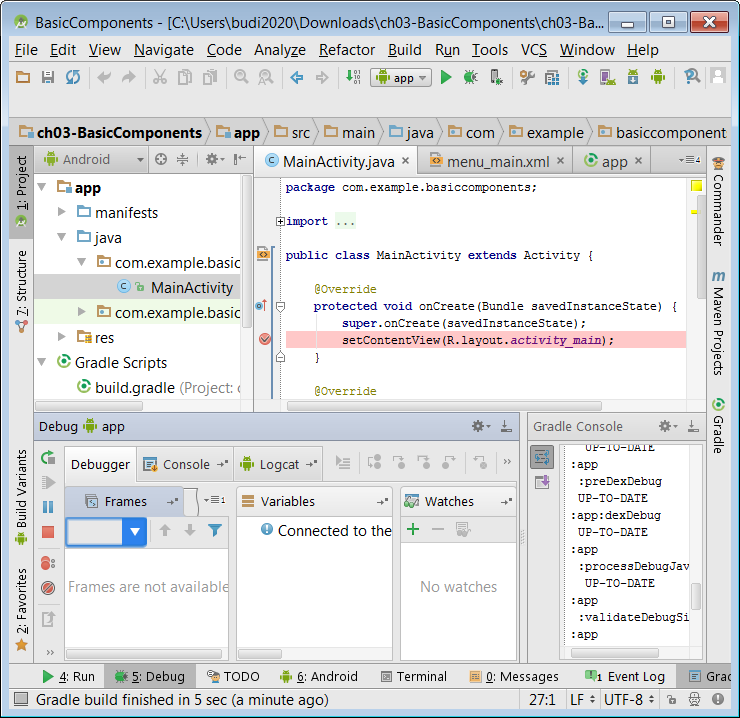
Here, you can step into your code, view variables, and so on.
